Pi Stocks
Quick Access to the NASDAQ
A Project By Thomas Sand and Shuhan Mao
Demonstration Video
Introduction
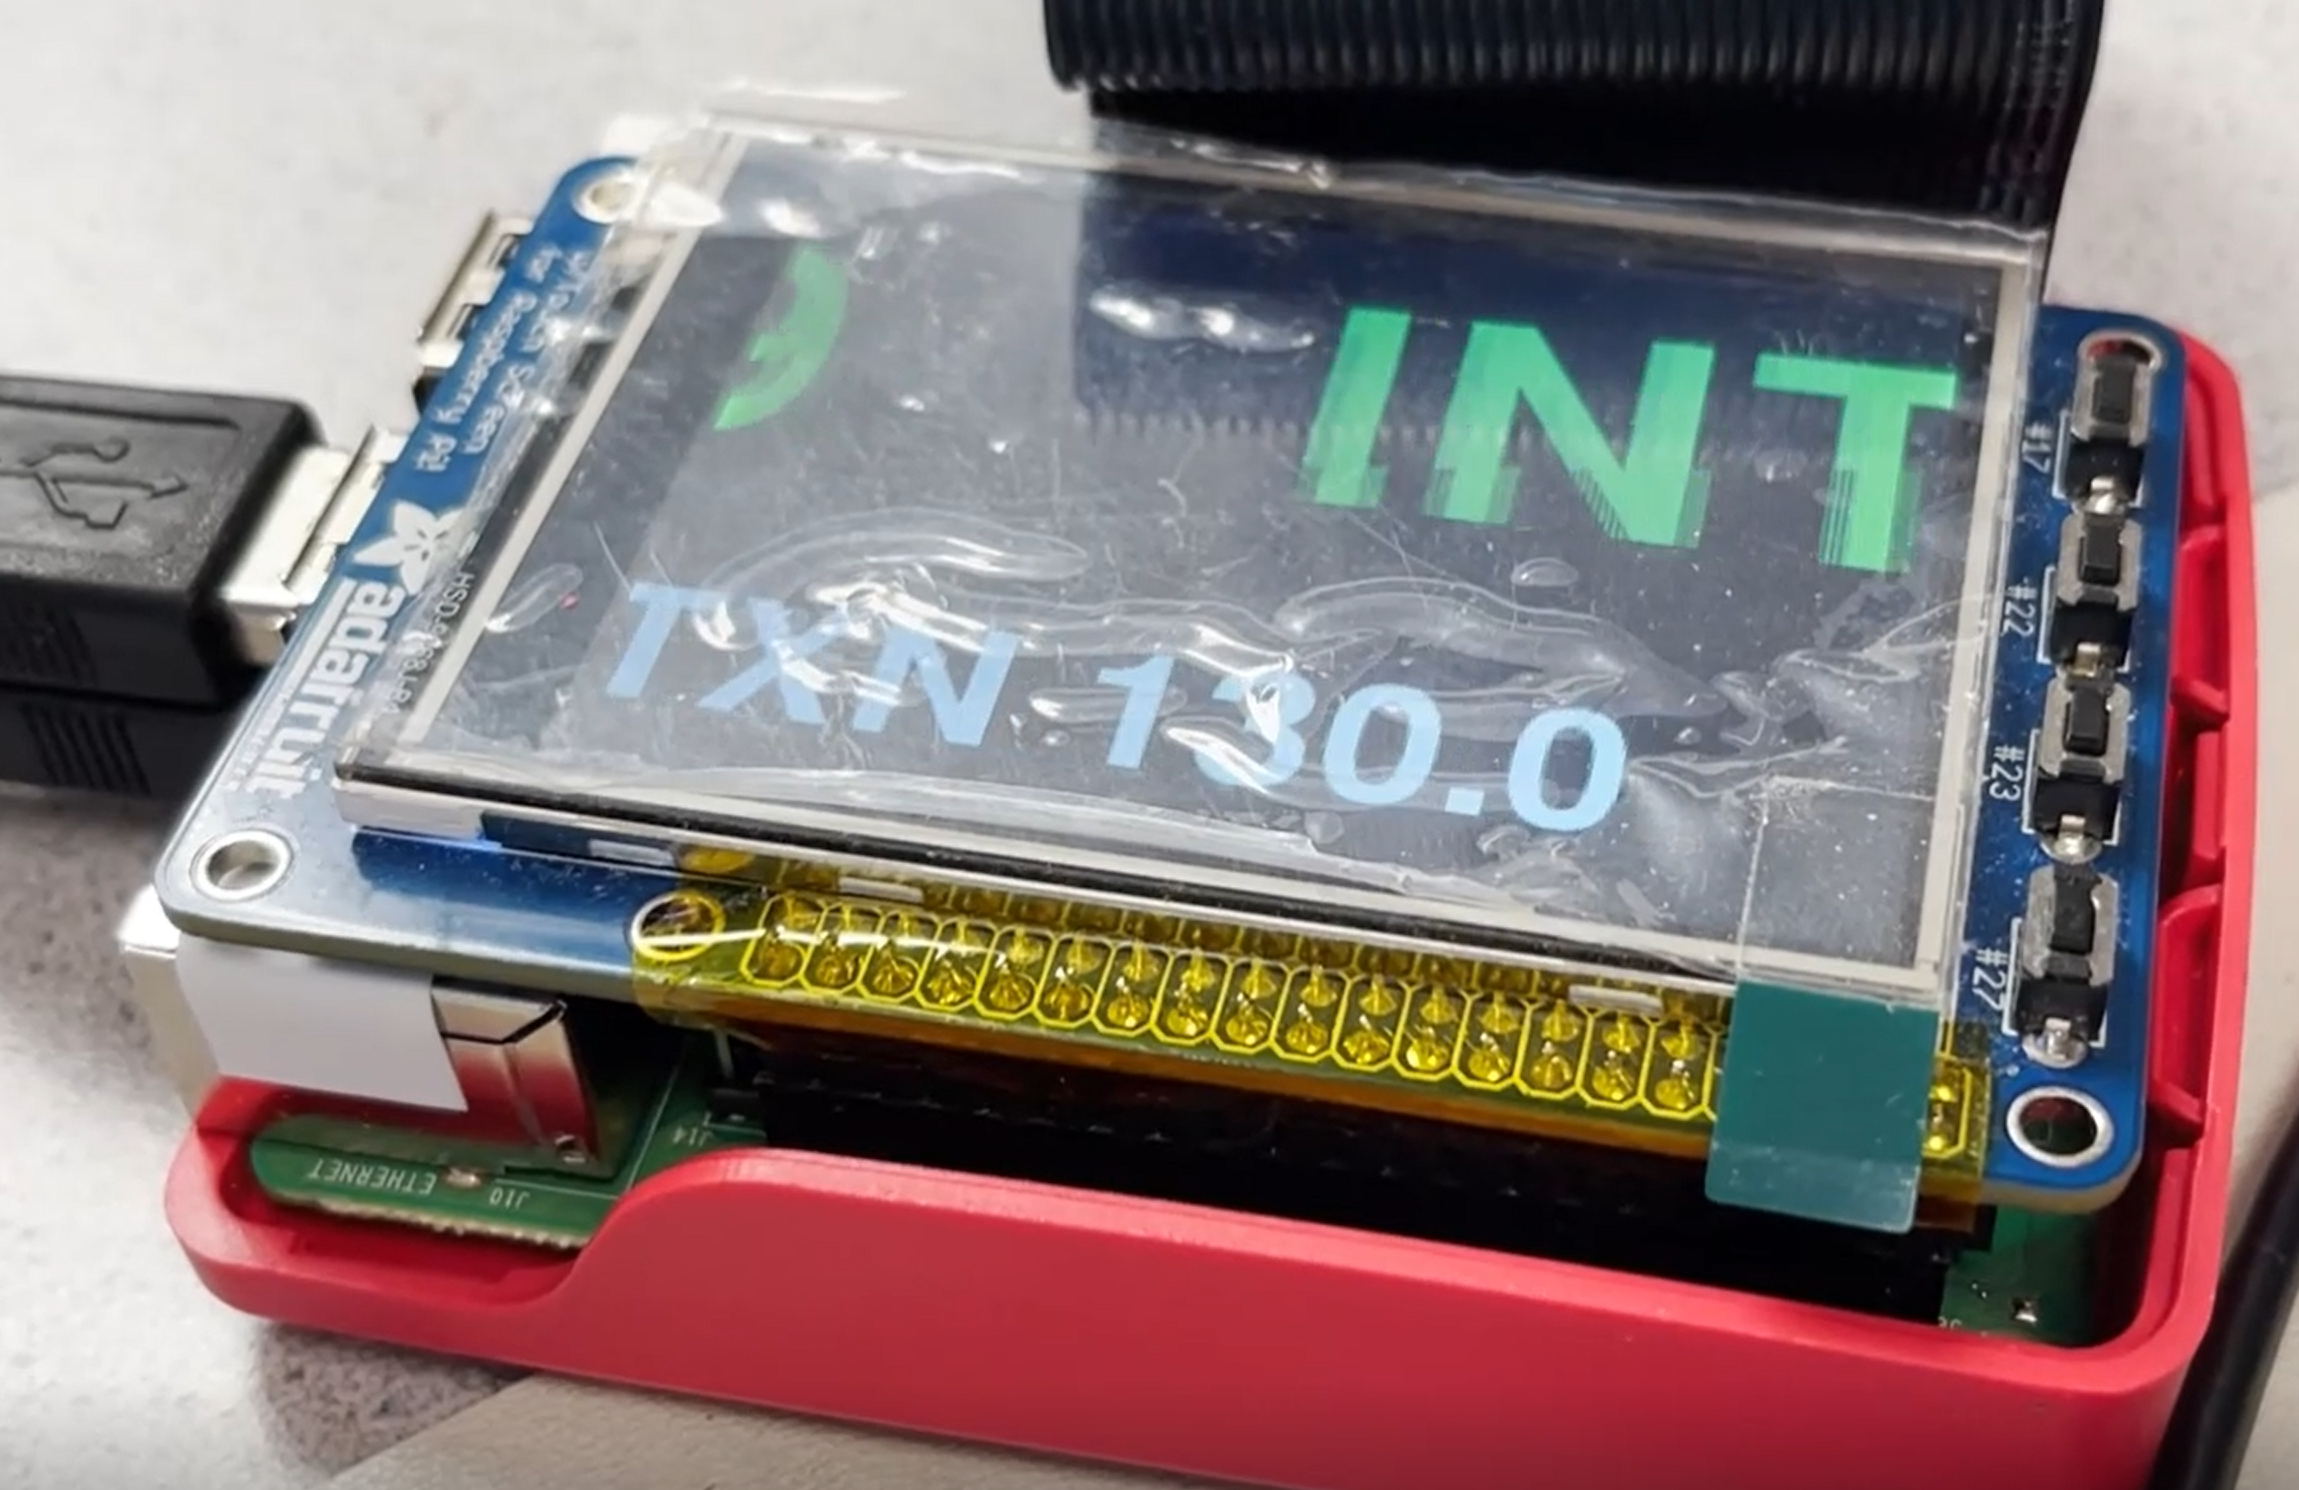
Are you tired of the stranglehold stocks have over your life? Tired of leaving 50 charts open wondering if you should sell? Leave that to pi stock! This project provides you with a simple interface to check on your portfolio and provide some info that might suggest how prices will change. Like the large LED boards in Times Square or on the trading floor, the screen scrolls stock names and prices. The display changes between green and red depending on if the stock price is going up or down. The advantage of this system is that it uses tensorflow models to make predictions about the stock price and displays those as well. This project uses an API, tensorflow, and network sockets to update and generate the values that scroll across the screen. All it requires is a raspberry pi, a screen (in this case, a piTFT), and a computer to run tensorflow (if the raspberry pi is 32-bit).
Project Objective:
- Provide a simple interface to inform the viewer about the value of different stocks
- Train tensorflow models to make predictions about stock prices
Design
The design of this project started with the screen. The first feature was getting the display to scroll text on the screen and add on the next word at a constant pace so none of the words run into each other, but also leave no significant gaps. Once the display was capable of scrolling text, the API call was added. The problem with the API call was that it takes a relatively long time to complete. The call is placed in the same loop that updates the screen. Updating the screen appears to take no time since every piece of text is updated then the screen makes all changes simultaniously. The API call seemed to add a stutter where suddenly the screen stops entirely as the API accesses the internet then waits for a response. We assumed that adding a tensorflow model predictor on top of this would make the program appear even slower and periodically freeze the display. To get around this, the project separates the display and the predictions into two python programs that run simultaneously. The API used for this project only allows for 8 calls in a minute, so to cut down on the number of API calls the program makes, the values for each stock are stored in a text file. This way when the program starts up it reads in previous values from the file instead of waiting to make numerous API calls. The second issue came from the 32-bit raspberry pi. There is no 32-bit version of tensorflow or sklearn. As a result, we are unable to run the predictor program on the raspberry pi as we had intended. To get around this, the predictor is off-loaded to a computer which communicates with the raspberry pi. Once the predictor generates a value, it sends it to a fifo. The display function is constantly reading from the fifo and once it receives a prediction it generates a new text window and displays it on the screen along with the other values it is currently showing.
In this project, we are using a machine learning algorithm to perform stock price predictions. Specifically, we used LSTM (stands for Long Short Term memory) from Tensorflow to do this job since LSTM is the perfect tool for real-time series prediction. Since we can only train the model once for one set of data, we decided to train the closing stock price. That way the stock ticker can print the predicted closing price of this day based on yesterday's closing stock value.The flow of the code starts from preprocessing the data by first loading the datasets, checking and deleting all rows including null values, and printing out the summary of the dataset. Then we extracted the column of closing price into one dataset that is prepared for training the LSTM model. In order for the data set to fit into the Tensorflow function, we then need to rescale the stock prices to (-1, 1). Finally, we allocated the dataset into two parts, one for training, and the other for testing.
How it works
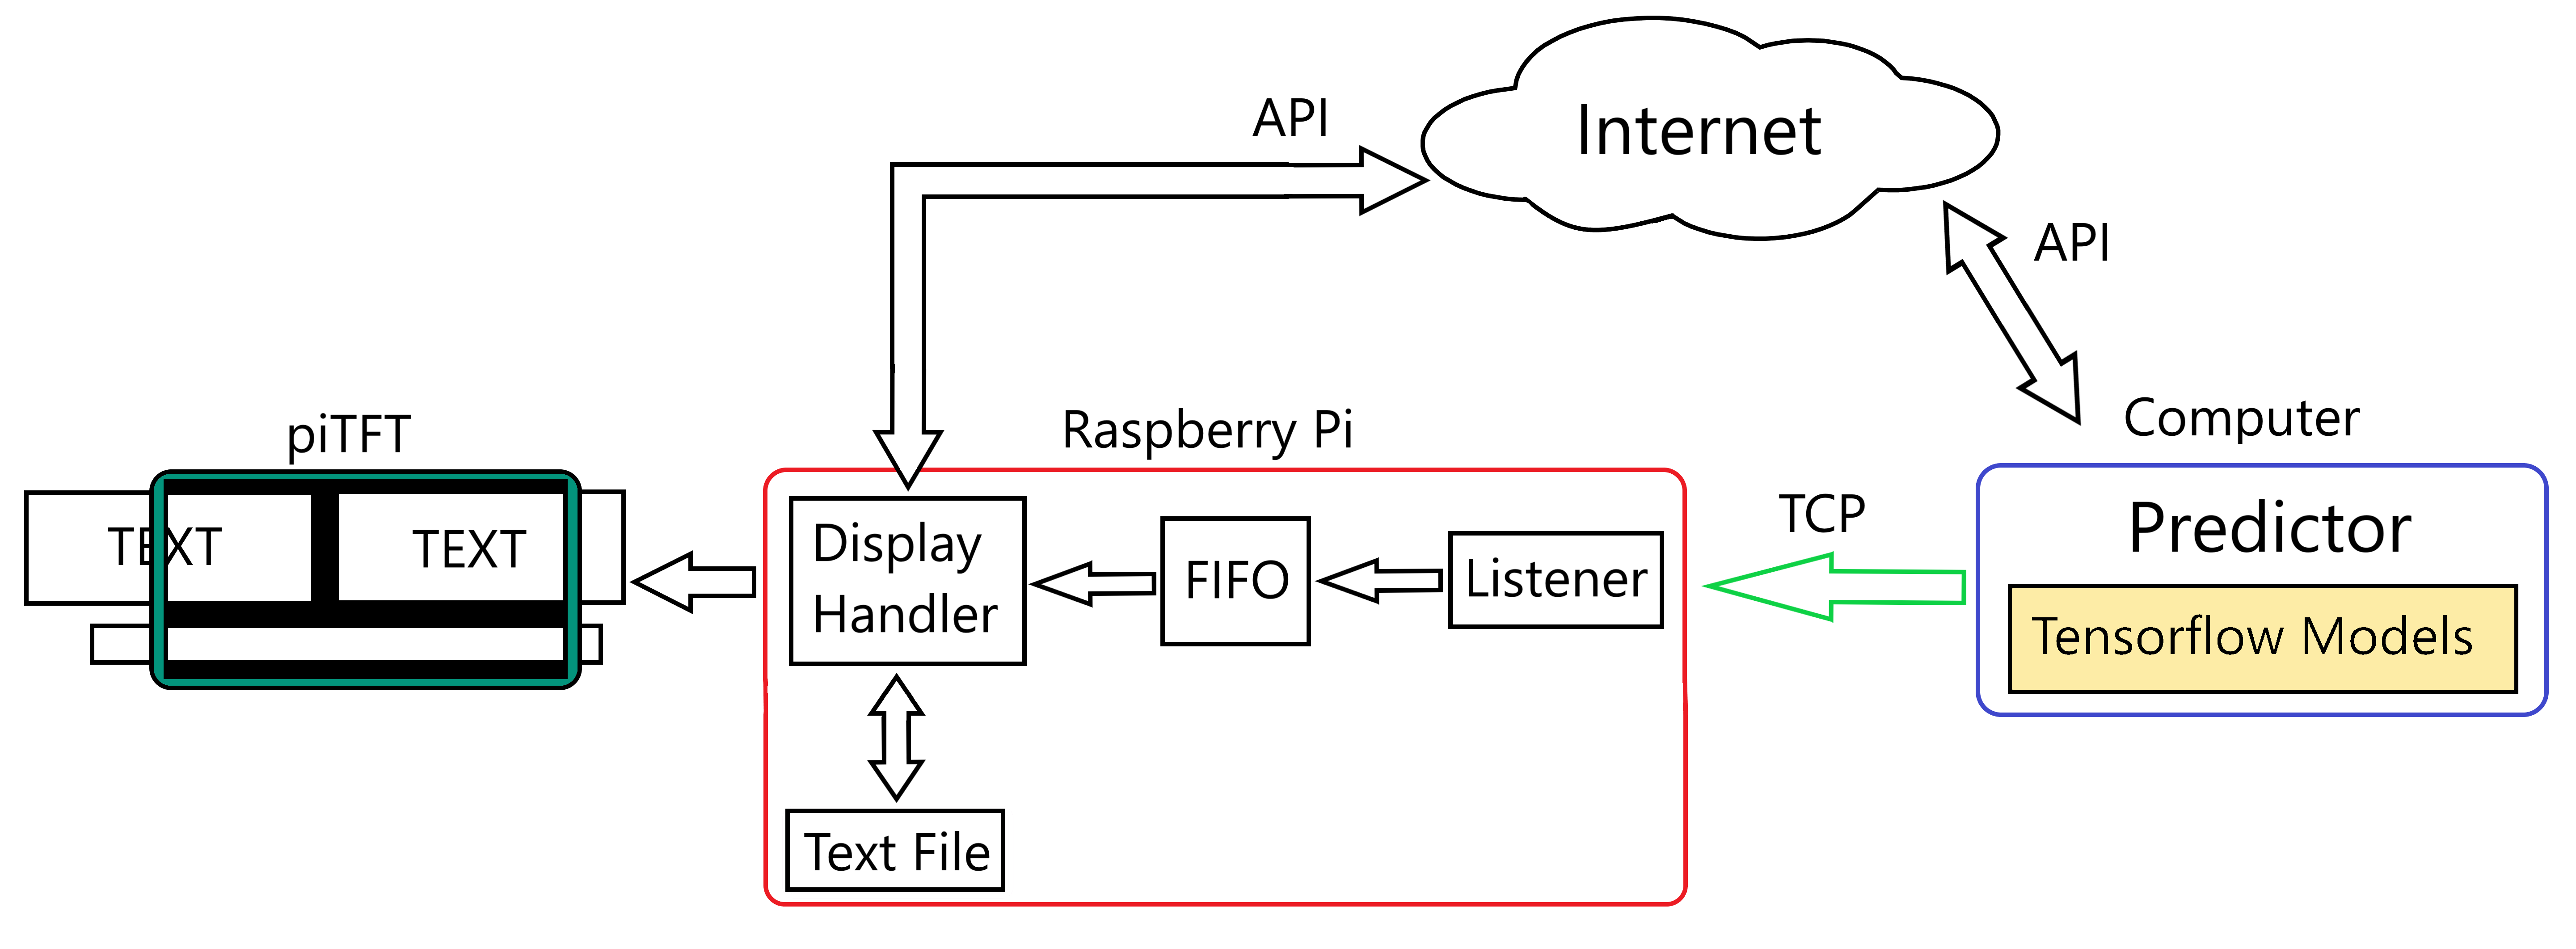
Here is a diagram of how the system operates. The predictor function contains a set of trained tensorflow models meant ot predict what the stock's closing price price will be. To guess the closing value of today, the function needs yesterday's closing value. To obtain this value, the predictor function makes API calls to aquire yesterday's data for each stock in the list. Once it receives a value, it makes a guess then connects to the raspberry pi over LAN. The raspberry pi has a program listening for a prediction from the predictor. Once it receives a value, it puts the value in the fifo. The program that handles the display is constantly checking the fifo for new values to display, and displays no prediction of there is nothing in the fifo. At start up, the raspberry pi reads in a text file will the names of all the stocks you want to check and the previous prices the program had stored. This provides the display with two arrays that make up what it will scroll across the screen. Along side the predictor, the display handler also makes periodic API calls to get the current value of each stock. As these values are updated the screen updates what it displays. Any text that the display handler receives is put into a display object and scrolled across the screen. When the program on the raspberry pi is terminated by the quit button, the names and values of the stocks are written back into the text file so they can be retrieved for later use.
Testing
The tesing process began with the display. Once the function was written to handle printing the stock names and prices one after the other, it first ran simple words with no acctual input. This checked that it worked with very long or very short names and prices. Once the display was verified, the API calls were added. To make sure the API was not triggered too often, the program would print out the time every time it made a call. Once the API caller was verified to trigger at the correct interval and return a valid number, the output of that function was fed into the printer. Testing the fifo connection started out with a simple reading program and writing program. This was just to verify how to get each function to access the fifo. Once it was determined how to easily access the fifo, the display function had some lines added to read from the fifo and generate a new window for the prediction. The predicting function was tested first by simply loading a model and requesting a prediction for just one value. Further testing added on the ability for the model predictor to access information on the stocks and use that information to guess the price change. The predictor was then given lines to write to the fifo and the loop was complete.
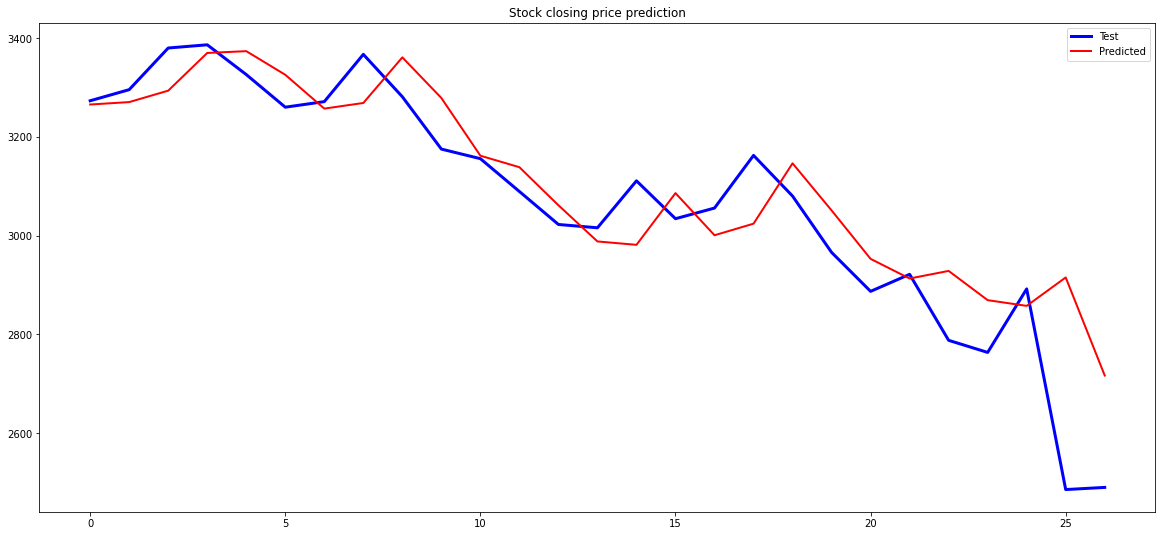
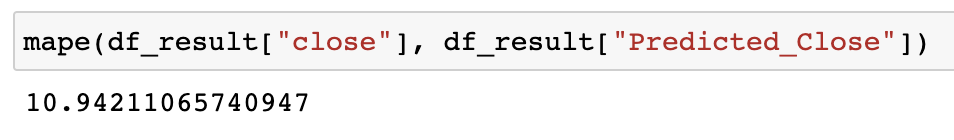
After the model has been trained, we used the most recent two days of stock prices for prediction and then compared them for their real values. It ended with a mean absolute percentage error (MAPE) of less than or equal to 13% for the 8 companies tested, which is fairly acceptable. This method was found to be more accurate when testing across 100 days instead of 100 months.
Result
The result of this project is a display screen that can access the internet and other computers on the network to provide real time stock values and predictions about the closing prices of stocks. This since tensorflow cannot run on the 32-bit raspberry pi, the code provided here allows the pi and computer to work in tandum to update the displayed values. To run prediction system, one must first gather the data for each stock they want to predict in a csv. The model trainer will use that data to generate a scaler file and a model file. Once those are in the path defined in the predictor function (sender.py), you are able to send predictions. The raspberry pi runs 3 files. First you must have a test file, where each line contains an abbreviated stock name comma separated from a price value. Once you have the list file, the shell script and the two python files (listener.py and stock_tracker.py), simply run the shell script. You do not need to have the predictor function running if you do not want it. The piTFT will continue to display and update values even if it never receives a closing prediction. To obtain more accurate values I recommend this be left on for an extended period of time.
Work Distribution

Project group picture

Thomas Sand
tms265@cornell.edu
Designed display and program communication.

Shuhan Mao
sm2376@cornell.edu
Trained tensorflow models and wrote the predicting function.
Parts List
- Raspberry Pi $35.00
- piTFT $34.95
Total: $69.95
Code Appendix
# Coordinates Display and Prediction Reader
#! /usr/bin/bash

FILE=FIFO
if [ ! -p "$FILE" ]; then
    mkfifo FIFO
fi

echo "kickstart" > FIFO &
./listener.py &
./stock_tracker.py

pkill -P $$
# Prediction Sender (sender.py)
#! /usr/bin/python3

import os
import sys
import signal
import requests
import time
import csv
import socket
import numpy as np
import pickle
import tensorflow as tf
from tensorflow.keras.models import load_model


HOST = "10.49.66.69"  # The server's hostname or IP address
PORT = 65432  # The port used by the server

def handler(signum, frame):
    os.system('clear')
    sys.exit()

def get_model(model_path, scaler_path, stock_price):
    #stock_price is a 2-D array
    #model = load_model(model_path)
    model = pickle.load(open(model_path,'rb'))

    scaler = pickle.load(open(scaler_path,'rb'))
    sc = scaler.transform(stock_price)

    estimate = model.predict(sc)
    estimate = scaler.inverse_transform(estimate)
    return estimate

def getClose(name_string): # Return yesterday's closing price
    url = "https://twelve-data1.p.rapidapi.com/time_series"

    querystring = {"symbol":name_string,"interval":"1day","outputsize":"1","format":"json"}

    headers = {
        "X-RapidAPI-Host": "twelve-data1.p.rapidapi.com",
        "X-RapidAPI-Key": ""
    }

    response = requests.request("GET", url, headers=headers, params=querystring)
    converted = response.json()
    price_string = converted['values'][0]['close'].rstrip("0")
    return round(float(price_string), 2)


def csv_to_data():
    data = []
    with open('names_prices.txt','r') as FD:
        reader = csv.reader(FD)
        for row in reader:
           data.append(row[0])
           data.append(row[1])

    FD.close()
    return data

signal.signal(signal.SIGINT, handler)
names_and_prices = csv_to_data()
stock_names = names_and_prices[::2]
name_index = 0

while True:

    last_close = getClose(stock_names[name_index])
    close_price = np.reshape(last_close, (-1, 1))
    scalerfile = "model_files/" + stock_names[name_index] + "_scaler"
    modelfile = "model_files/My_"+ stock_names[name_index] + "_model.sav"

    forcast = get_model(modelfile, scalerfile, close_price)
    forcast = forcast[0][0]
    forcast_str = str(round(forcast,2))
    forcast_str = "Est. Close: " + stock_names[name_index] + " " + forcast_str

    with socket.socket(socket.AF_INET, socket.SOCK_STREAM) as s:
        s.connect((HOST, PORT))
        s.sendall(forcast_str.encode('utf-8'))
        s.close()

    name_index += 1
    if name_index >= len(stock_names):
        name_index = 0

    time.sleep(180)
# Display Handler (stock_tracker.py)
#! /usr/bin/python3

import time
from datetime import datetime
import requests
import json
import os
import RPi.GPIO as GPIO
import pygame
import sys
import numpy as np
import csv
from pygame.locals import *

os.nice(30)

os.putenv('SDL_VIDEODRIVER','fbcon')
os.putenv('SDL_FBDEV','/dev/fb1')
os.putenv('SDL_MOUSEDRV','TSLIB')
os.putenv('SDL_MOUSEDEV','/dev/input/touchscreen')

def GPIO27_callback(channel): # Triggered by physical exit button
    global EXIT
    EXIT = True

def getPrice(name_string): # Returns string value for price of valid NASDAQ stock id (ex. TXN)
    url = "https://twelve-data1.p.rapidapi.com/price"

    querystring = {"symbol": name_string,"format":"json","outputsize":"30"}

    headers = {
        "X-RapidAPI-Host": "twelve-data1.p.rapidapi.com",
        "X-RapidAPI-Key": ""
    }

    response = requests.request("GET", url, headers=headers, params=querystring)
    converted = response.json()
    return converted['price'].rstrip("0")

def getChart(name_string): # Gets 100 points from 1month, IDK if should be adjustable
    url = "https://twelve-data1.p.rapidapi.com/time_series"

    querystring = {"symbol":"AMZN","interval":"1day","outputsize":"30","format":"json"}

    headers = {
        "X-RapidAPI-Host": "twelve-data1.p.rapidapi.com",
        "X-RapidAPI-Key": ""
    }

    response = requests.request("GET", url, headers=headers, params=querystring)
    fieldnames = ['datetime', 'open', 'high', 'low', 'close', 'volume']
    json_data = response.json()
    filename = name_string + '_data.csv'
    with open(filename, 'w') as SDcsv:
        writer = csv.DictWriter(SDcsv, fieldnames=fieldnames)
        writer.writeheader()
        writer.writerows(json_data['values'])

    SDcsv.close()


def data_to_csv(n, p):
    with open('names_prices.txt','w') as FD:
        writer = csv.writer(FD)
        for x in range(len(n)):
            data = [n[x], p[x]]
            writer.writerow(data)

    FD.close()

def csv_to_data():
    data = []
    with open('names_prices.txt','r') as FD:
        reader = csv.reader(FD)
        for row in reader:
           data.append(row[0])
           data.append(row[1])

    FD.close()
    return data


GPIO.setmode(GPIO.BCM) # set as broadcom
GPIO.setup(27, GPIO.IN, pull_up_down=GPIO.PUD_UP) # set GPIO27 to pullup
GPIO.add_event_detect(27, GPIO.FALLING, callback=GPIO27_callback)

EXIT = False
SCROLL = True
PRINT_1 = True
PRINT_2 = False

pygame.init()
pygame.mouse.set_visible(False)

# Background
WHITE = 255,255,255
BLACK = 0,0,0
RED = 255,0,0
GREEN = 55,235,52
width = 320
height = 240
SCREEN = pygame.display.set_mode((width,height))

# Words
FONT = pygame.font.Font(None,160)
small_FONT = pygame.font.Font(None,80)

class window:
    addElement = True
    def __init__(self, text, color):
        self.text = text
        self.surface = FONT.render(text, True, color)
        self.loc = [(width + int(self.surface.get_width()/2)), 80]
        self.rect = self.surface.get_rect(center = self.loc)
        self.trigger = width - int(self.surface.get_width()/2)
        self.EXIT = -1*int(self.surface.get_width()/2)

    def move(self):
        self.loc[0] -= 1

    def update(self):
        self.rect = self.surface.get_rect(center = self.loc)
        SCREEN.blit(self.surface,self.rect)

class subwindow:
    addElement = True
    def __init__(self, text):
        self.text = text
        self.surface = small_FONT.render(text, True, WHITE)
        self.loc = [(width + int(self.surface.get_width()/2)), 200]
        self.rect = self.surface.get_rect(center = self.loc)
        #self.trigger = width - int(self.surface.get_width()/2)
        self.EXIT = -1*int(self.surface.get_width()/2)

    def move(self):
        self.loc[0] -= 1

    def update(self):
        self.rect = self.surface.get_rect(center = self.loc)
        SCREEN.blit(self.surface,self.rect)


class Timer: # Times when to make API call
    def __init__(self, sec): # Make object with a set time to wait
        self.stop_time = sec

    def start(self): # Get the start time of the timer
        self.start_time = time.time()

    def timesup(self): # Check if time has elapsed
        if time.time() > (self.start_time + self.stop_time):
            return True
        else:
            return False


# Stocks
names_and_prices = csv_to_data()
stock_name = names_and_prices[::2]
stock_price = names_and_prices[1::2]
old_price = stock_price
print_index = 0
update_index = 0

# Make initial Window
display = []
if float(stock_price[print_index]) > float(old_price[print_index]):
    color = GREEN
else:
    color = RED

new_text = '    ' + stock_name[print_index] + ': ' + stock_price[print_index]
display.append(window(new_text, color))
print_index += 1

# Timing Stuff
curr_time = time.time() # Loop Timout
now = datetime.now()
current_time = now.strftime("%H:%M:%S")
print("Time = ", current_time)
api_timer = Timer(120) # Price update timer
api_timer.start()

# Prediction Stuff
F = open('FIFO', 'r')

while not EXIT:

    from_fifo = F.read() # Read Prediction
    if from_fifo:        # If there is something in the FIFO
         display.append(subwindow(from_fifo))

    for obj in display:
        obj.move()
        obj.update()
        if (type(obj).__name__ == 'window'):
            if (obj.loc[0] < obj.trigger) and obj.addElement:
                obj.addElement = False
                new_text = '    ' + stock_name[print_index] + ': ' + stock_price[print_index]
                if float(stock_price[print_index]) > float(old_price[print_index]):
                    color = GREEN
                else:
                    color = RED
                display.append(window(new_text, color))
                print_index += 1
                if print_index >= len(stock_name):
                    print_index = 0

        if obj.loc[0] < obj.EXIT:
            display.remove(obj)


    if api_timer.timesup():
        now = datetime.now()
        current_time = now.strftime("%H:%M:%S")
        print("Time = ", current_time)
        old_price[update_index] = stock_price[update_index]
        stock_price[update_index] = getPrice(stock_name[update_index])
        api_timer.start()
        update_index += 1
        if update_index >= len(stock_name):
            update_index = 0


    pygame.display.flip()
    SCREEN.fill(BLACK)
    time.sleep(.005)

F.close()
GPIO.cleanup()
data_to_csv(stock_name, stock_price)
sys.exit()
# Prediction Reader (listener.py)
#! /usr/bin/python3

import socket
import os
import sys
import time

HOST = "0.0.0.0"  # Standard loopback interface address (localhost)
PORT = 65432  # Port to listen on (non-privileged ports are > 1023)

with socket.socket(socket.AF_INET, socket.SOCK_STREAM) as s:
    s.bind((HOST, PORT))
    while True:
        s.listen()
        conn, addr = s.accept()
        with conn:
            #print(f"Connected by {addr}")
            while True:
                data = conn.recv(1024)
                #print(data)
                if not data:
                    break
                F = open("FIFO", 'w', 1)
                F.write(str(data, 'UTF-8'))
                F.close()

s.close()
# -*- coding: utf-8 -*-
"""Stock_predict_project_ver.ipynb

Automatically generated by Colaboratory.

Original file is located at
    https://colab.research.google.com/drive/1xI1eEefH53TWqQ4jy6LyhFeRm20eeKp1
"""

## import libraries
import pandas as pd # linear algebra
import numpy as np # data processing, CSV file I/O (e.g. pd.read_csv)
import matplotlib.pyplot as plt
from keras.models import Sequential
import matplotlib.patches as mpatches
from keras.layers import Dense
from keras.layers import Dropout
from keras.layers import LSTM
from sklearn.preprocessing import MinMaxScaler
from sklearn.metrics import mean_squared_error
from pandas.api.types import CategoricalDtype
import os

"""#Reading the stock dataset


"""

df = pd.read_csv("/content/stock_data.csv") # Reading dataset

df["Date"] = pd.to_datetime(df["datetime"])
df.set_index("Date", inplace = True)

df.shape # looking at the shape. we have 30 rows and 5 columns

# We will estimate the next 2 days with the data we have, and to test this prediction, we extract the last 3 days of data from df.
df=df.iloc[::-1] #reverse the row order to place the most recent stocks at the bottom
Conclusion = df[-2:]
df = df[:-2]

df

data = df.copy()

df.describe() # looking at statistical info

df.shape #looking at the shape. we have 1689 rows and 6 columns

df.info() # looking at information

"""No null values found here."""

data

df.shape[0]

plt.figure(figsize = (20, 12))
x = np.arange(0, df.shape[0], 1)
plt.subplot(2,1,1)
#plt.plot(x, df.open.values, color = "red", label = "Open Stock Price")
plt.plot(x, df["close"].values, color = "blue", label = "Close Stock Price")
plt.title("Stock Prices of the recent 100days ")
plt.xlabel("Days")
plt.ylabel("Stock Prices in US Dollar")
plt.legend(loc = "best")
plt.grid(which = "major", axis = "both")

#Close equate to df because we want to guess.

df = df[["close"]]
df.head()

# Time series visualization of Close

plt.figure(figsize=(20,9))
plt.plot(df["close"])
plt.title("Time Series")
plt.xlabel("Date")
plt.ylabel("Stock closing price prediction")
plt.show()

df

df.iloc[:, 0]

#We compress the data between -1 and 1 using MinMaxScaler.

scaler = MinMaxScaler(feature_range=(-1,1))
sc = scaler.fit_transform(df)

df.shape

timestep = 1 # We will forecast the next 3 days using the data of the last 5 days.

X = []
Y = []

for i in range(len(sc) - (timestep)):
    X.append(sc[i:i+timestep])
    Y.append(sc[i+timestep])

X = np.asanyarray(X)
Y = np.asanyarray(Y)

k = 70  # The k value is determined according to the available data. For our data consisting of 27 rows, we use 20 for train and the rest for testing.

Xtrain = X[:k,:,:]
Xtest = X[k:,:,:]
Ytrain = Y[:k]
Ytest = Y[k:]

len(X)

# The shape of Xtrain and Xtest

print(Xtrain.shape)
print(Xtest.shape)

print(Ytrain.shape)
print(Ytest.shape)

df.isnull().sum() # checking null values

"""# LSTM model training start

"""

from keras.layers import Dense, RepeatVector
from keras.layers import Flatten
from keras.layers import TimeDistributed
from keras.layers.convolutional import Conv1D
from keras.layers.convolutional import MaxPooling1D

# We should pay attention to the number of inputs and outputs during the construction of the LSTM model. We should have 5 inputs and 5 outputs.

epochs = 200
model = Sequential()

model.add(LSTM(64, activation = "relu", input_shape = (1,1), return_sequences = True))
model.add(LSTM(64, activation = "relu", return_sequences = True))
model.add(LSTM(32, activation = "sigmoid", return_sequences = False))
model.add(Dense(1))
model.compile(optimizer = "adam", loss="mse")

history = model.fit(Xtrain,Ytrain, epochs= epochs, batch_size = 32, verbose=0)

model.save("AMZN_model.h5")

import pickle
with open("AMZN_pickle_model", "wb") as file:
    pickle.dump(model, file)

import pickle
with open("AMZN_scaler", "wb") as file:
    pickle.dump(scaler,file)


model_filename = "My_AMZN_model.sav"
saved_model = pickle.dump(model, open(model_filename,'wb'))

print('Model is saved into to disk successfully Using Pickle')

plt.figure(figsize=(8,5))
plt.plot(history.history['loss'])
plt.xlabel("Epochs")
plt.ylabel("Loss")
plt.title("Model Accuracy")

preds = model.predict(Xtest)
preds = scaler.inverse_transform(preds)

Xtest2 = [[0.6]]
pred2 = model.predict(Xtest2)

Ytest = np.asanyarray(Ytest)
Ytest = Ytest.reshape(-1,1)
Ytest =scaler.inverse_transform(Ytest)

Ytrain = np.asanyarray(Ytrain)
Ytrain = Ytrain.reshape(-1,1)
Ytrain = scaler.inverse_transform(Ytrain)

mean_squared_error(Ytest,preds)

# Graphing the test and predicted values for Close.

plt.figure(figsize=(20,9))
plt.plot(Ytest[:,0], 'blue', linewidth=3)
plt.plot(preds[:,0],'r' , linewidth=2)
plt.legend(('Test','Predicted'))
plt.title("Stock closing price prediction")
plt.show()

"""##Stock Predictions on Close prices

"""

# we create new DataFrame separately for our prediction and test data.


test = pd.DataFrame(Ytest, columns = ["Close"])
pred = pd.DataFrame(preds, columns = ["Close_pred"])

def insert_end(Xin,new_input):
    #print ('Before: \n', Xin , new_input )
    for i in range(timestep-1):
        Xin[:,i,:] = Xin[:,i+1,:]
        #print(f"ilk giren değerler {Xin}")
    Xin[:,timestep-1,:] = new_input

    return Xin

# We add to the end we guessed.

from datetime import timedelta
future = 2
forecast = []
Xin = Xtest[-1:, : , :]
time = []
for i in range(future):
    out = model.predict(Xin, batch_size = 1)
    forecast.append(out)
    Xin = insert_end(Xin, out[0,0])
    time.append(pd.to_datetime(data.index[-1]) + timedelta(days = i + 1))

time

# We inverse_transform the prediction outputs.

forecasted_output = np.asanyarray(forecast)
forecasted_output = forecasted_output.reshape(-1,1)
forecasted_output = scaler.inverse_transform(forecasted_output) #back to actual value

np.asanyarray(forecast).reshape(-1,1)

forecasted_output

#Date file forecasted_output

forecasted_output = pd.DataFrame(forecasted_output)
date = pd.DataFrame(time)
df_result = pd.concat([date,forecasted_output],axis=1)
df_result.columns = "Date","Predicted_Close"

#prin the predicted stock prices of next two days
df_result

df_result.set_index("Date", inplace = True)

#We combine conclusion with df_result and plot it.

df_result = pd.concat([df_result, Conclusion], axis=1)

def mape(y_true, preds):
    y_true, preds = np.array(y_true), np.array(preds)
    return np.mean(np.abs((y_true - preds) / y_true)) * 100 #in percentage

mape(df_result["close"], df_result["Predicted_Close"])